Live · 8,500+ Mutual Funds

Every mutual fund, ranked. Pick better with data.

Rank 8,500+ live funds by category, rating, risk and returns from 1 day to 10 years — Direct or Regular. See where your funds sit in their category, how much they overlap, and what the category leaders would have earned instead.

🎁 Full access for 30 days · No credit card required · Daily NAV · Direct & Regular
8,500+ funds ranked Returns 1D → 10Y Portfolio Insights Holdings overlap
mf.fnotrader.com
Mutual Funds screener — every fund ranked by category, rating, risk and 1D–10Y returns
8,500+
Live funds ranked
12
Goal-based baskets
40+
Fund houses
Daily
NAV refresh
The problem

Picking a fund by last year's return is how you end up with a laggard.

Star-rating apps push whatever ran recently, hide the Direct plan, and never tell you your three funds hold the same 30 stocks.

You chase last year's winner

A #1 fund on 1-year return is often a mean-reversion trap. Without seeing rank across 3Y/5Y and vs the category median, you buy the top of a hot streak.

Your funds secretly overlap

Three "diversified" flexi-caps can share 60% of their holdings — you're paying three fees for one bet, and you'd never know without a holdings-overlap read.

You leave the Direct plan on the table

Regular plans quietly cost ~1% a year in commissions. Over a decade that's a fifth of your corpus — most tools default you to Regular anyway.

Built for fund investors

Data, not star ratings.

Six tools that turn 8,500 funds into a shortlist you can actually defend — and keep your existing portfolio honest.

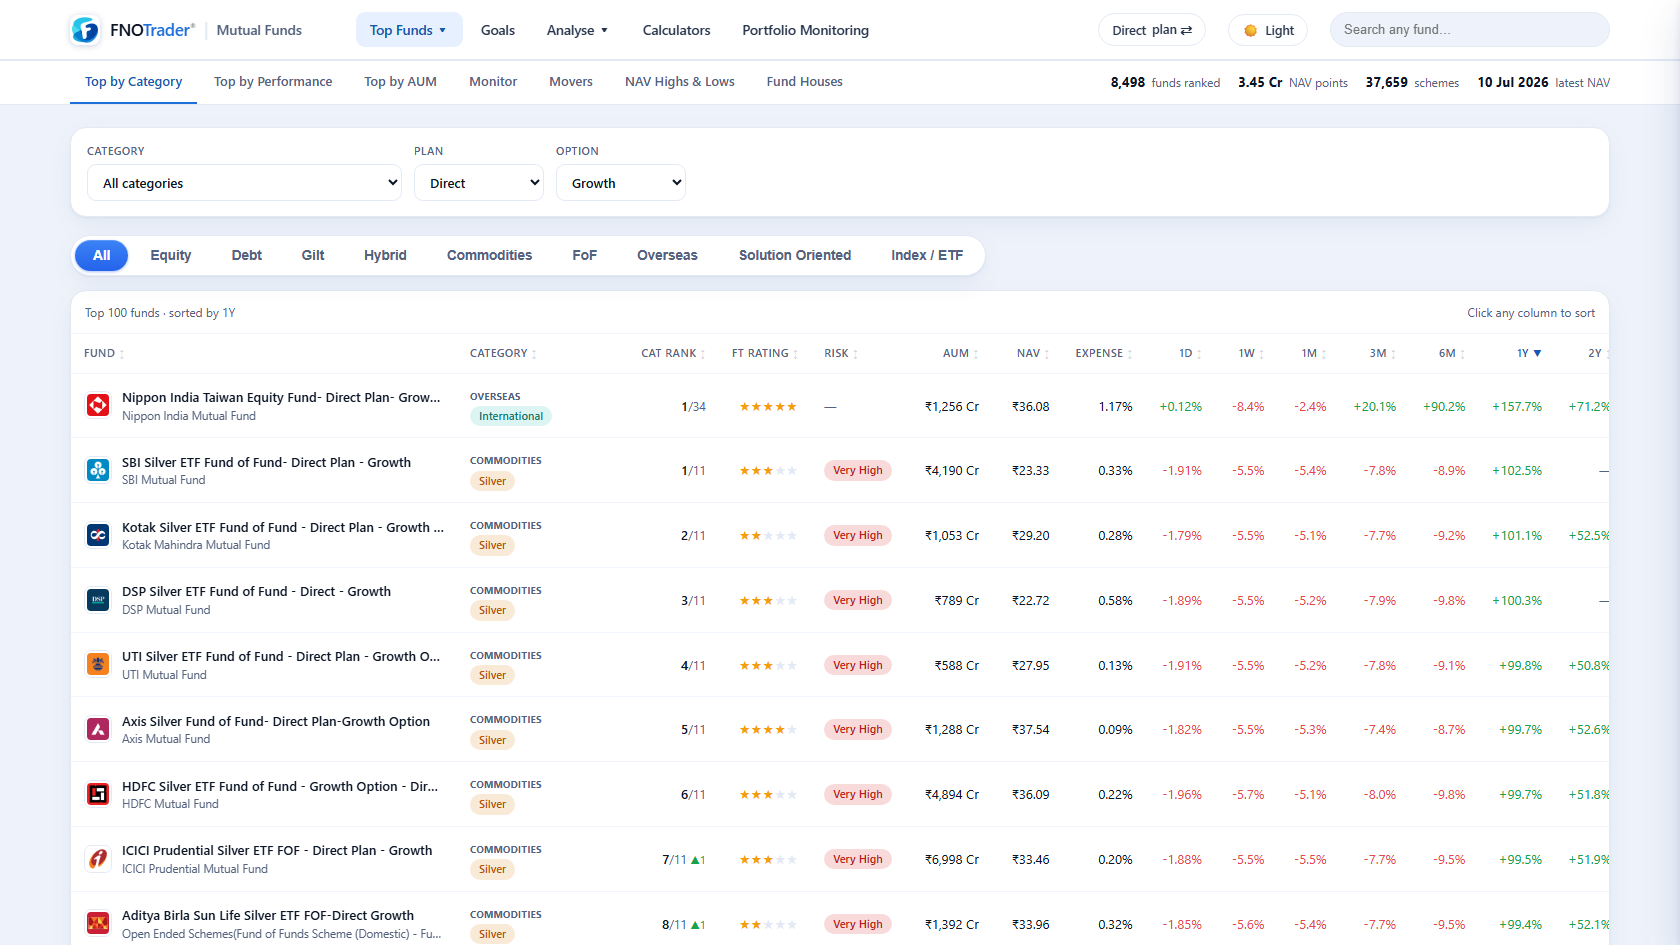
01 · The Screener

Rank every fund the way a pro would.

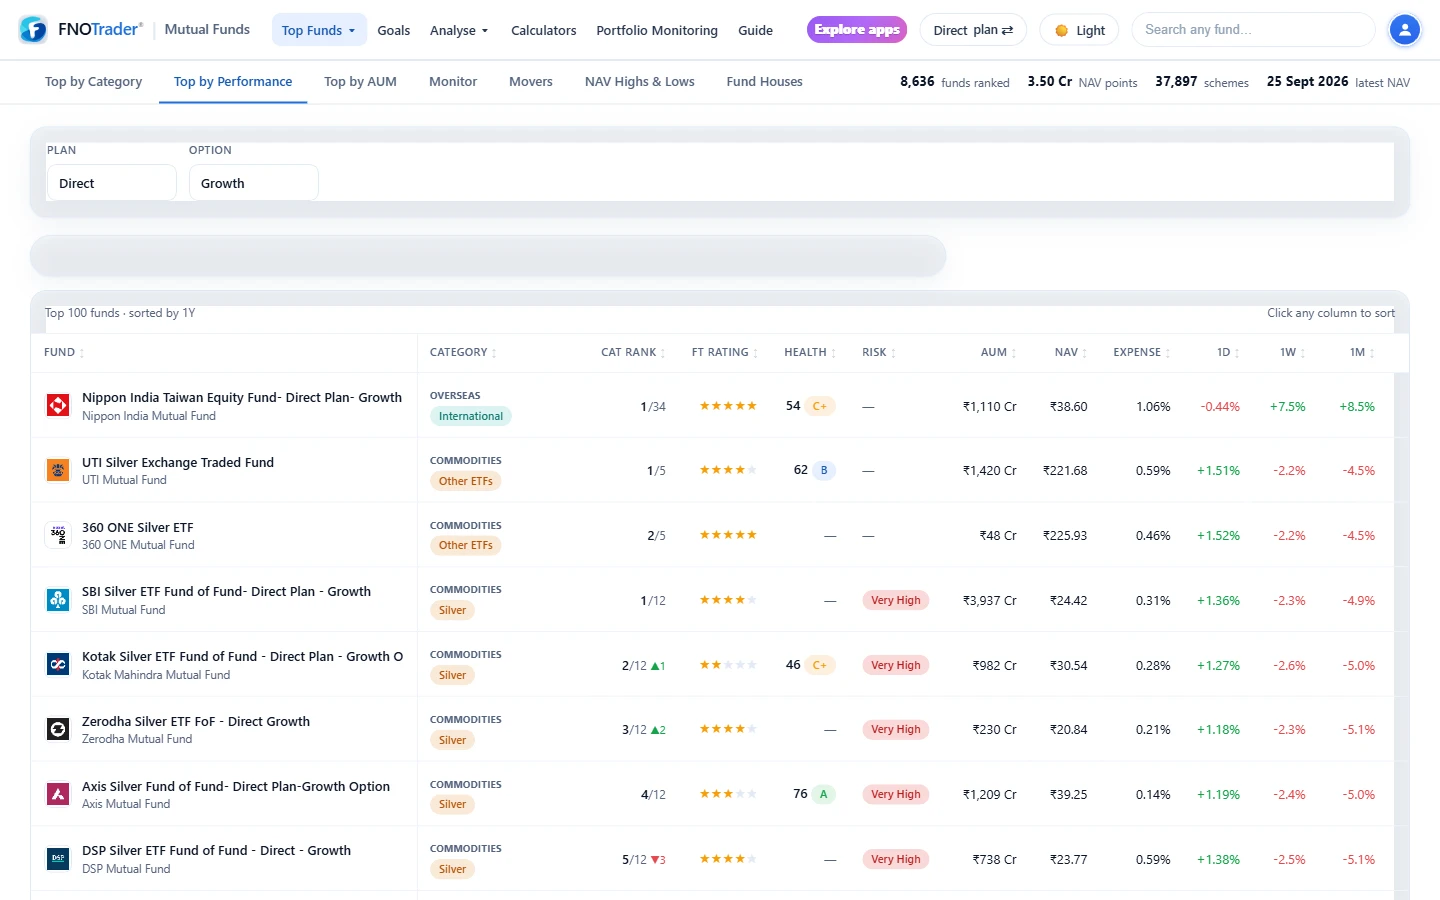
One table for the whole market — sort by any window, filter by category, risk, rating or fund house, and flip Direct ↔ Regular in one click.

  • Returns for 1D · 1W · 1M · 3M · 6M · 1Y · 2Y · 3Y · 5Y · 10Y, plus alpha vs the right benchmark
  • Category rank, FT rating, risk grade, AUM, expense & NAV — one uniform row
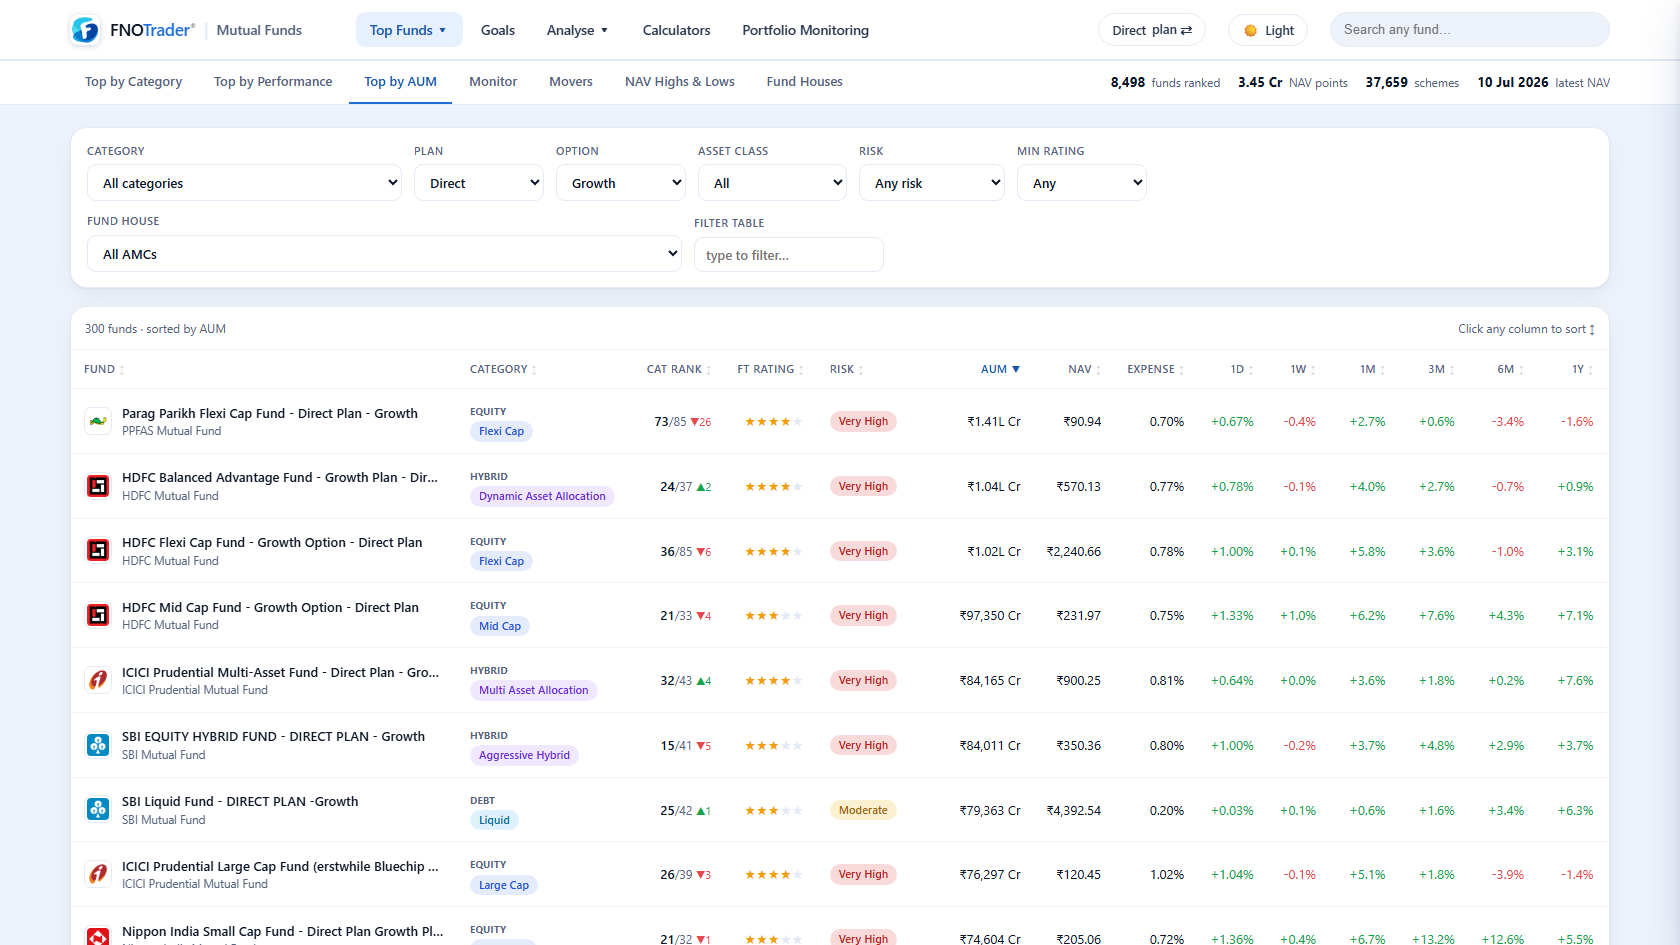
  • By Category · By Performance · By AUM · Fund Houses — every view, same columns
Top Funds · By Performance
Fund screener table ranked by return with category, rating, risk, AUM and 1D–10Y columns
02 · Funds for every Goal

Start from the goal, not the fund name.

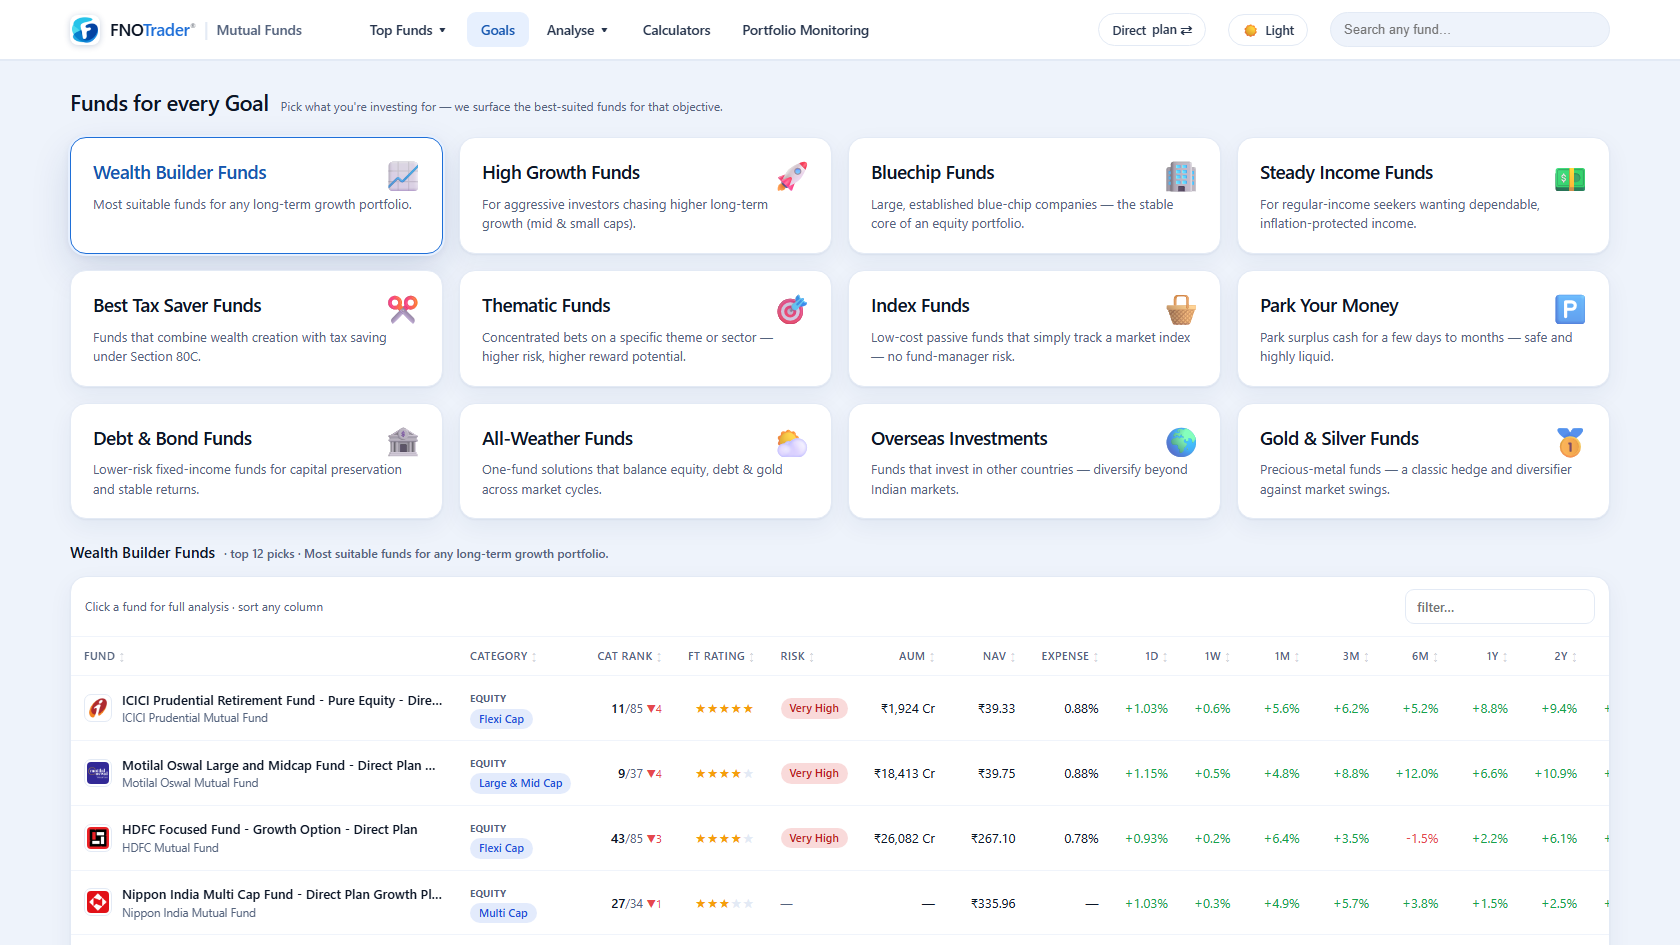
You don't want "a fund" — you want wealth creation, tax saving, or a place to park cash. We map each goal to the best-suited funds.

  • 12 baskets — Wealth Builder, High Growth, Bluechip, Thematic, Index, Tax Saver, Steady Income, Debt, All-Weather, Overseas, Gold & Silver, Park Money
  • Each basket ranks its funds by the metric that matters for that goal
  • One row per fund — no duplicate plan/option clutter
Funds for every Goal
Goal baskets grid — Wealth Builder, Tax Saver, Index and more, each opening a ranked fund list
03 · Fund Monitor

See which category is working — at a glance.

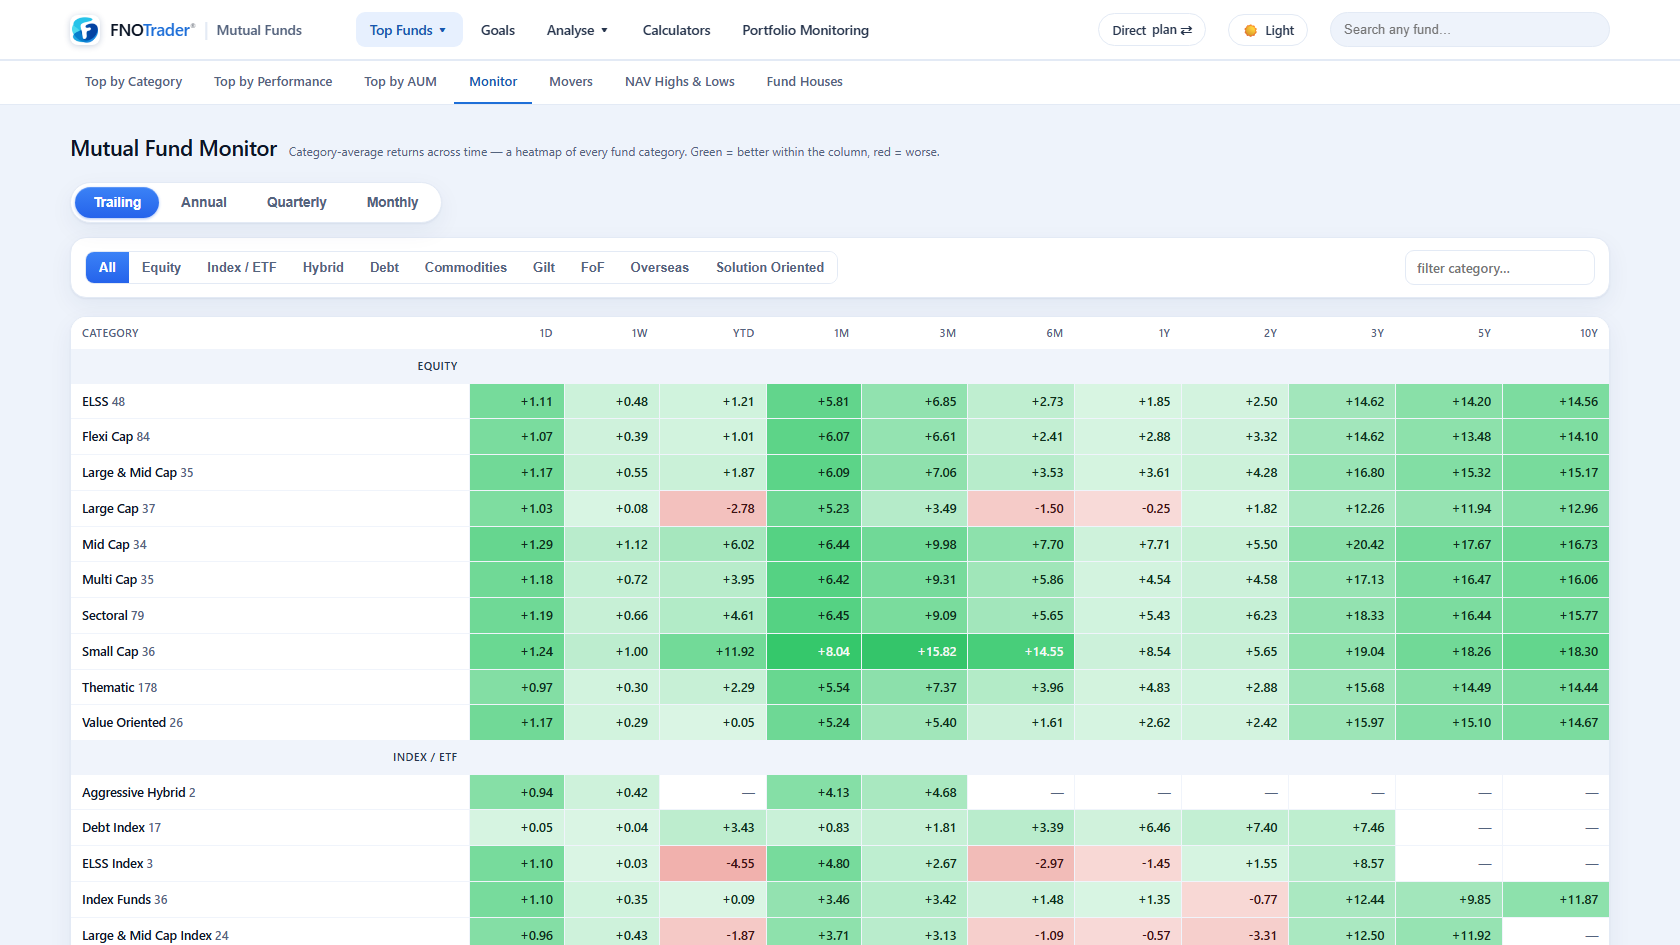
Returns tables are noise. A heatmap of category-average returns across time shows you where the money is flowing, instantly.

  • Category-average returns as a green→red heatmap — Trailing, Annual, Quarterly & Monthly
  • Grouped by asset class — Equity, Index/ETF, Hybrid, Debt, Commodities, Gilt…
  • Live funds only — no dead side-pocket schemes skewing the averages
Mutual Fund Monitor
Category-returns heatmap across timeframes, grouped by asset class
04 · Compare & Overlap

Two funds, side by side — and how much they share.

Choosing between funds means comparing growth, risk, ratios — and knowing whether they're really two bets or one in disguise.

  • Overlaid growth chart (TradingView Lightweight) + a full metric-by-metric table
  • Add benchmark indices — Nifty 50, 500, Midcap 150, Smallcap 250 & more
  • Holdings overlap — the exact % of portfolio two funds hold in common
Compare Funds
Compare funds — overlaid growth chart vs benchmark and a side-by-side metric table
05 · Portfolio Insights

What your funds are really doing — and what you're missing.

Upload your holdings (CAS PDF, Excel or manual) and get more than a value total: the honest read most portfolio trackers won't give you.

  • Overlap between every pair of funds — redundancy flagged in red
  • Each fund's category rank — leader, above-median or laggard
  • Opportunity — "if you'd held each category's best fund, you'd have ₹X more"
Portfolio Insights
Portfolio insights — overlap, category rankings and an opportunity estimate vs category leaders
06 · Deep fund analysis

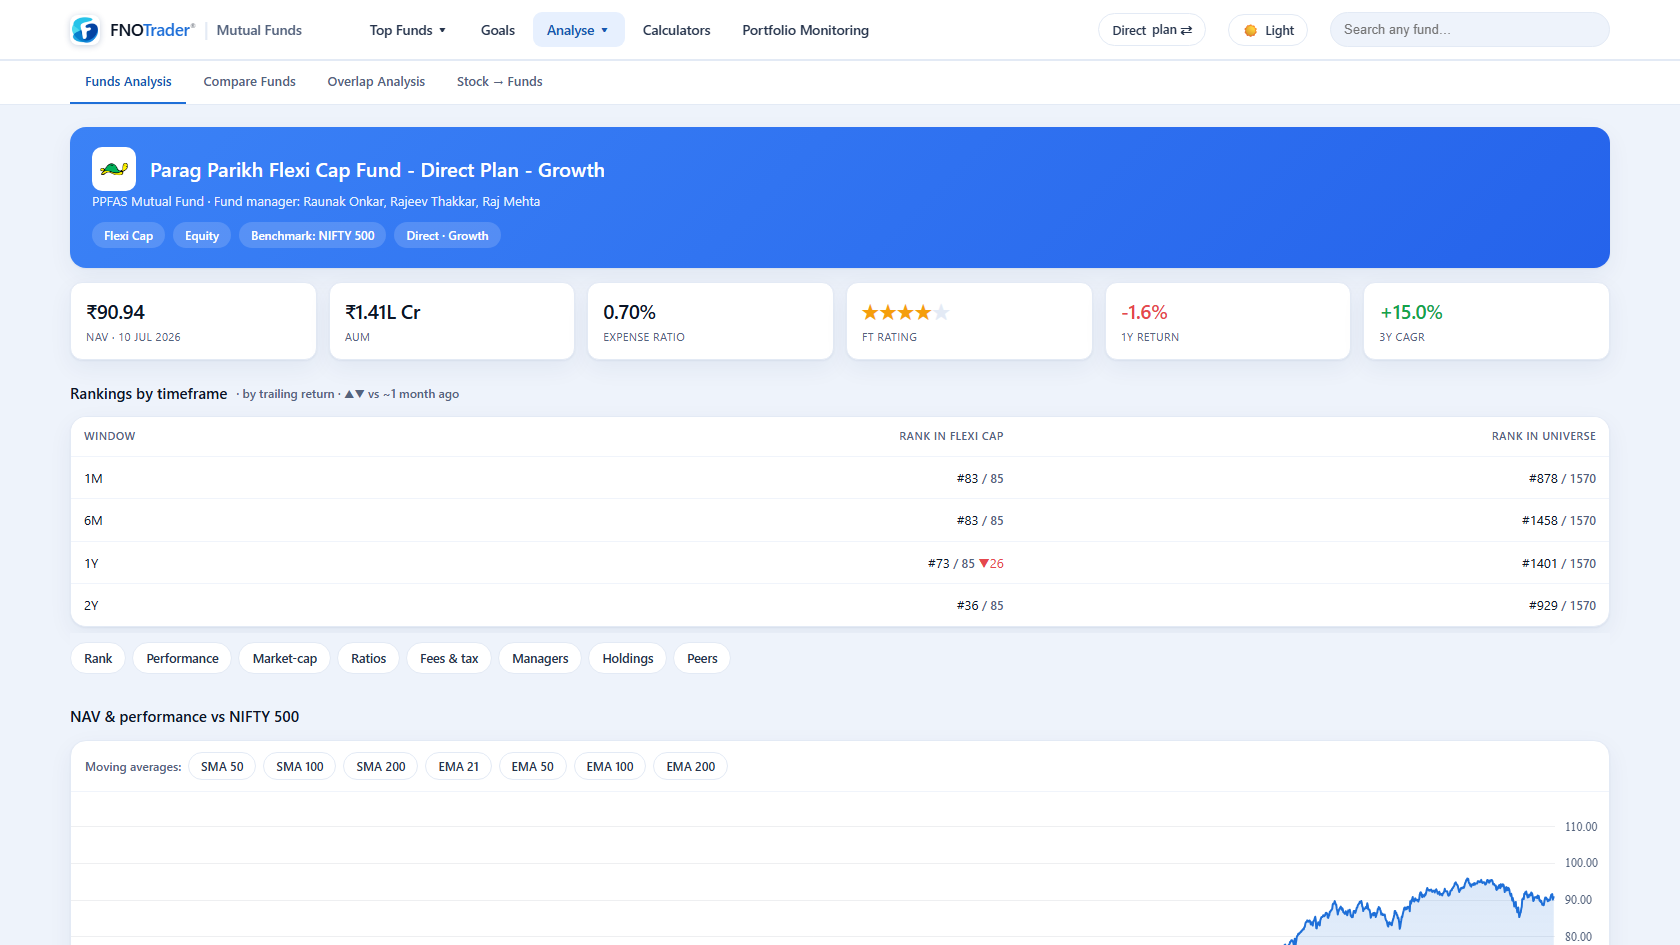
Everything about one fund, on one page.

Before you commit, you want the full picture — NAV history, rolling returns vs benchmark, holdings, manager and peers.

  • Sharp NAV chart, rank in universe & category, timeframe breakdown
  • Holdings, manager's other funds, and same-category peers with overlap
  • Stock → Funds — which mutual funds hold any given stock, and how much
Fund Analysis
Single-fund analysis — NAV chart, rolling returns vs benchmark, holdings and peers
One subscription

The whole desk — screen, compare, monitor & audit.

A real research desk for Indian mutual funds — not a star-rating list bolted onto a distributor app.

Screen & rank
🏆
Top Funds

By Category · Performance · AUM — one uniform ranked table.

🎯
Funds for every Goal

12 goal baskets, each with its best-suited funds ranked.

🔥
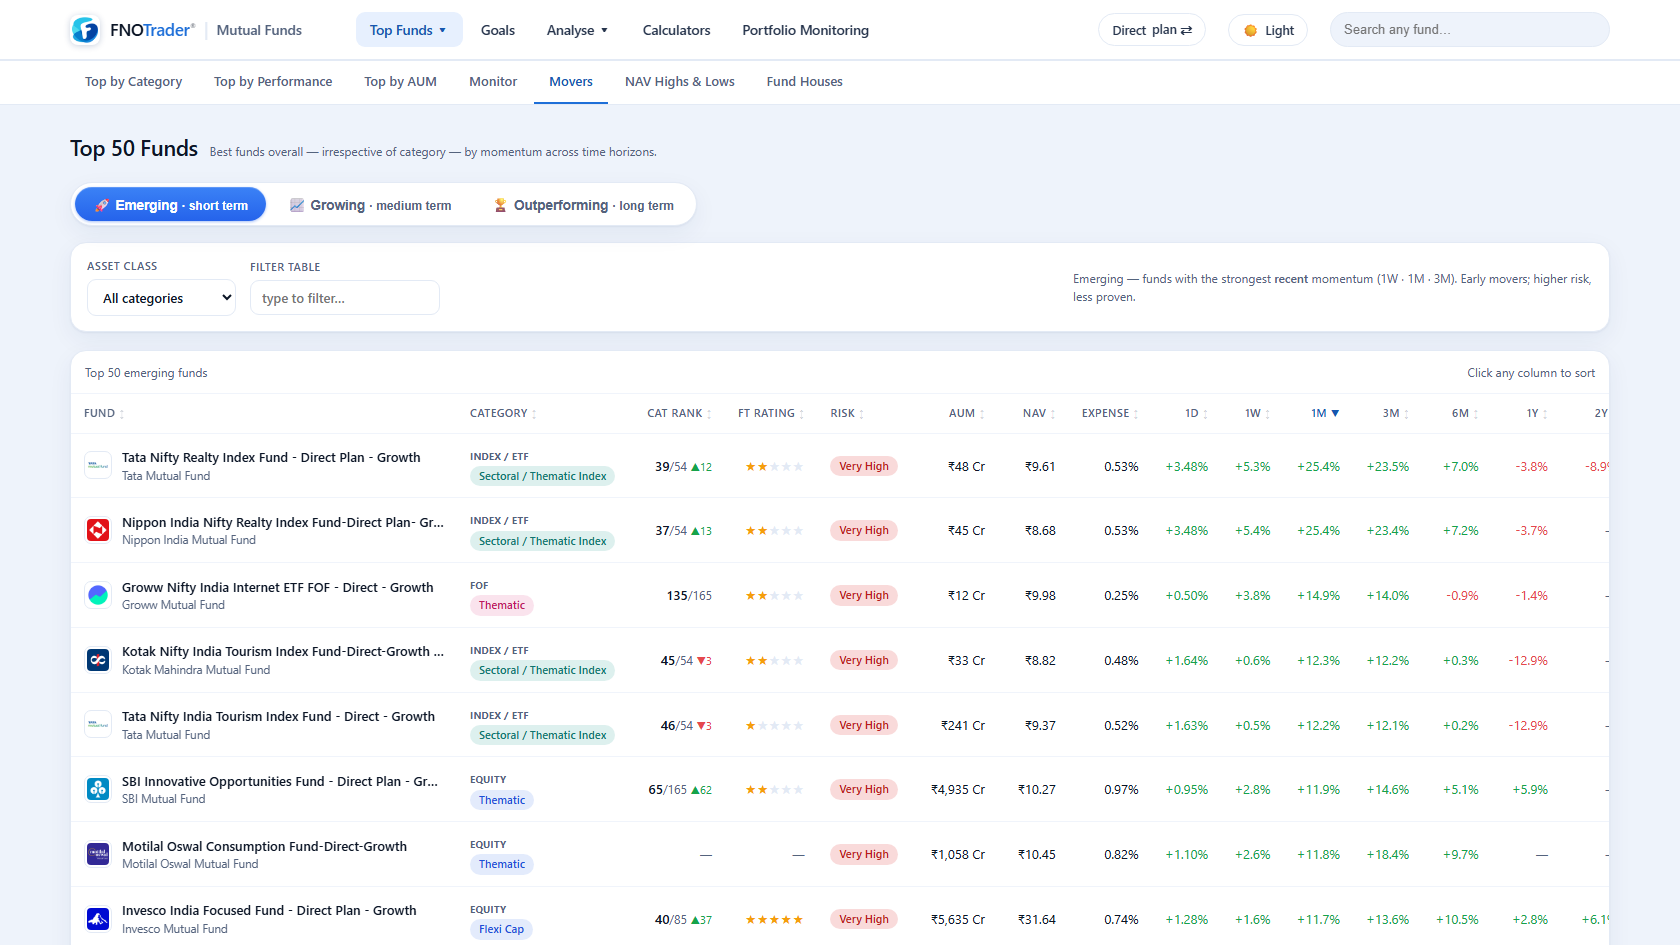
Movers

Emerging, growing & outperforming funds, refreshed daily.

📈
NAV Highs & Lows

All-time / 52-week highs & lows, distance from ATH.

🏦
Fund Houses

Browse every AMC — funds, AUM & ratings in one place.

🔁
Direct ↔ Regular

App-wide toggle — ranks & ratings per plan.

FT Rating & Risk

Our performance rating + risk grade on every fund.

⏱️
10 return windows

1D · 1W · 1M · 3M · 6M · 1Y · 2Y · 3Y · 5Y · 10Y.

Monitor & compare
🗺️
Fund Monitor

Category-returns heatmap — Trailing / Annual / Quarterly / Monthly.

⚖️
Compare Funds

Up to 4 funds — overlaid growth, risk, ratios & ratings.

🧬
Overlap Analysis

Exact % of holdings any two funds share.

📊
Benchmark alpha

Every fund vs the right index — Nifty 50/500/Midcap/Smallcap.

🥧
Category median

See how a fund stacks vs the median & leader in its group.

🖥️
Lightweight charts

Sharp, fast TradingView charts across the app.

Your portfolio
📂
Portfolio Monitoring

Units, invested, current value & P&L per fund.

📄
CAS / Excel import

Upload a CAMS/KFintech CAS or a spreadsheet — parsed locally.

Portfolio Insights

Overlap, category rank & the opportunity vs leaders.

🏅
Rank in category

Leader / above-median / laggard on every holding.

💡
Opportunity estimate

What each category's best fund would have earned you.

🔎
Stock → Funds

Which funds hold a given stock, and how much.

🧮
SIP & goal calculators

Project growth and plan contributions.

🔗
Stocks-app bridge

Mutual-fund ownership shown right inside a stock's page.

Simple pricing

Start free for 30 days. One price after.

Every plan includes the full app — screener, goals, monitor, compare, overlap & Portfolio Insights.

Free Trial
₹0/ 30 days
Full access · no card
  • The complete app for 30 days
  • All screens, goals & insights
  • No credit card required
Start free trial
Monthly
₹299/ mo
+ 18% GST · cancel anytime
  • Everything in the app
  • Daily NAV & all updates
  • Month-to-month, no lock-in
Start monthly
Best value
Yearly
₹2,999/ yr
+ 18% GST · ≈ ₹250/mo
  • Everything in the app, all year
  • Daily NAV & all updates
  • Included in the all-apps Combo
Go yearly

Prices exclude 18% GST. Already subscribe to another FNOTrader app? Mutual Funds is included in the all-apps Combo — and existing active plans get it free until your current subscription renews. See all plans →

Questions

Everything else you might ask.

How many funds does it cover?

Every currently-live Indian mutual fund — 8,500+ schemes across 40+ AMCs, refreshed with the latest NAV daily. Dead and matured schemes (side-pockets, closed FMPs) are excluded so ranks and category averages reflect funds you can actually buy today.

Does it show Direct or Regular plans?

Both — with an app-wide toggle. A fund is one fund; the plan is just how you buy it (Direct vs Regular, Growth vs IDCW). Search and screens collapse the variants to a single row and rank per your selected plan, so you always compare like for like — and can see exactly what the Direct plan saves you.

Can I analyse my existing portfolio?

Yes. Upload a CAMS/KFintech CAS PDF, a spreadsheet, or add funds manually. Beyond value and P&L, Portfolio Insights shows how much your funds overlap, where each ranks in its category, and an estimate of what the category leaders would have earned on the same money — the honest read most trackers skip. Parsing happens on our servers; nothing is shared with third parties.

Do I need a broker or demat account?

No. This is a research & analytics tool — it doesn't transact or place orders, so nothing to link. Screen and compare funds here, then invest through whichever platform you already use.

Is there a free trial, and do I need a card?

Yes — 30 days of full access with no credit card. After that it's ₹2,999/year (+18% GST). It's also bundled into the FNOTrader all-apps Combo, and existing active-plan subscribers get Mutual Funds free until their current plan renews.

Is this investment advice?

No. FNOTrader is a technology product, not a SEBI-registered investment adviser or research analyst. The rankings, ratings, comparisons and portfolio insights are decision-support data for informational and educational use only — not a recommendation to buy, sell or hold any fund. Mutual fund investments are subject to market risks; read all scheme-related documents carefully and consult a SEBI-registered adviser before investing.

Stop guessing. Rank every fund with data.

Start your 30-day free trial — the whole app, no credit card.

Create your free account →
Already have an account? Sign in